At the request of the non-partisan Jewish Electorate Institute, researchers at the American Jewish Population Project at Brandeis University’s Social Research Institute conducted an analysis of hundreds of national surveys of US adults to describe the Jewish electorate in each of the 435 districts of the 116th US Congress and the District of Columbia. Surveys include the American National Election Studies, the General Social Survey, Pew Political and social surveys, the Gallup Daily Tracking poll, and the Gallup Poll Social Series. Data from over 1.4 million US adults were statistically combined to provide, for each district, estimates of the number of adults who self-identify as Jewish and a breakdown of those individuals by age, education, race/ethnicity, political party self-identification, and political ideology.
The following reports present a portrait of the Jewish electorate in eight states: Arizona, Colorado, Florida, Georgia, Michigan, Ohio, Pennsylvania and Wisconsin, as well as a portrait of Jewish adults ages 18 to 34 and political independents.
Full Arizona Report

The majority (~80%) of Jewish adults in Arizona resides in five congressional districts that include parts of Tucson, Phoenix, and other metropolitan areas within Maricopa County. The majority (55%) of Arizona’s Jewish electorate identifies with or leans toward the Democratic Party compared with 65% of the Jewish electorate nationally.
Full Colorado Report
The majority (~56%) of Jewish adults in Colorado resides in three congressional districts that include much of the metropolitan areas of Denver, Boulder, and Fort Collins. Nearly two thirds (64%) of Colorado’s Jewish electorate identifies with or leans toward the Democratic Party compared with 65% of the Jewish electorate nationally.
Full Florida Report
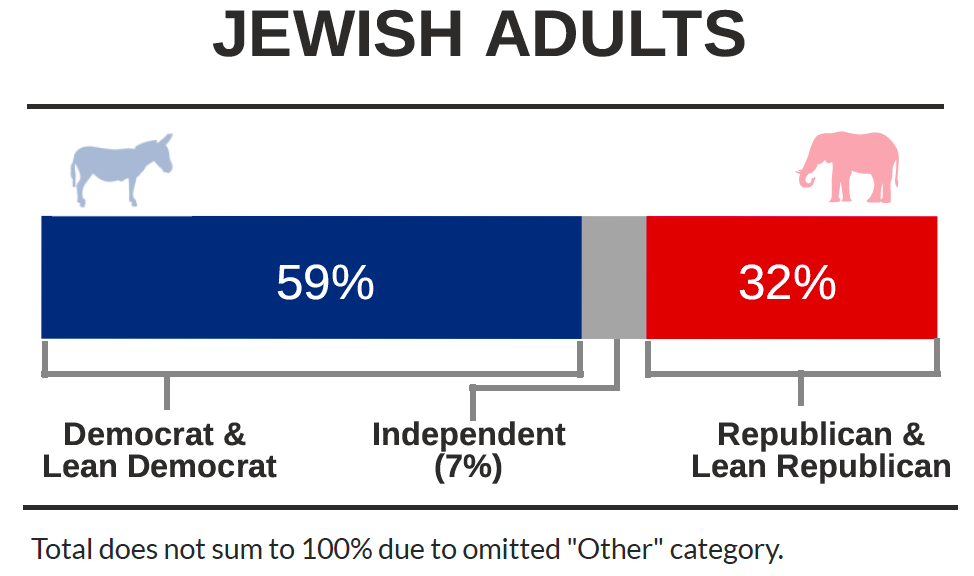
The majority (~73%) of Jewish adults in Florida resides in seven congressional districts on the southeastern coast that include the metropolitan areas around Miami, Fort Lauderdale, and Palm Beach. Over half (59%) of Florida’s Jewish electorate identifies with or leans toward the Democratic Party compared with 65% of the Jewish electorate nationally.
Full Georgia Report
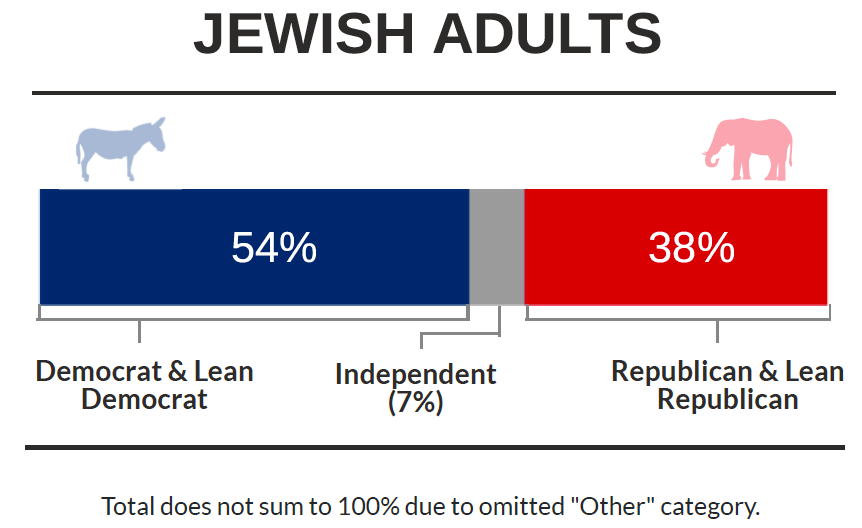
The majority (~68%) of Jewish adults in Georgia resides in congressional districts within the Atlanta metropolitan area. More than half (54%) of Georgia’s Jewish electorate identifies with or leans toward the Democratic Party.³ This is lower than the Jewish electorate nationally (65%)
Full Michigan Report
The majority (~77%) of Jewish adults in Michigan resides in congressional districts that include the metropolitan areas around Detroit, Ann Arbor, and Lansing. Nearly two thirds (61%) of Michigan’s Jewish electorate identifies with or leans toward the Democratic Party compared with 65% of the Jewish electorate nationally.
Full Ohio Report
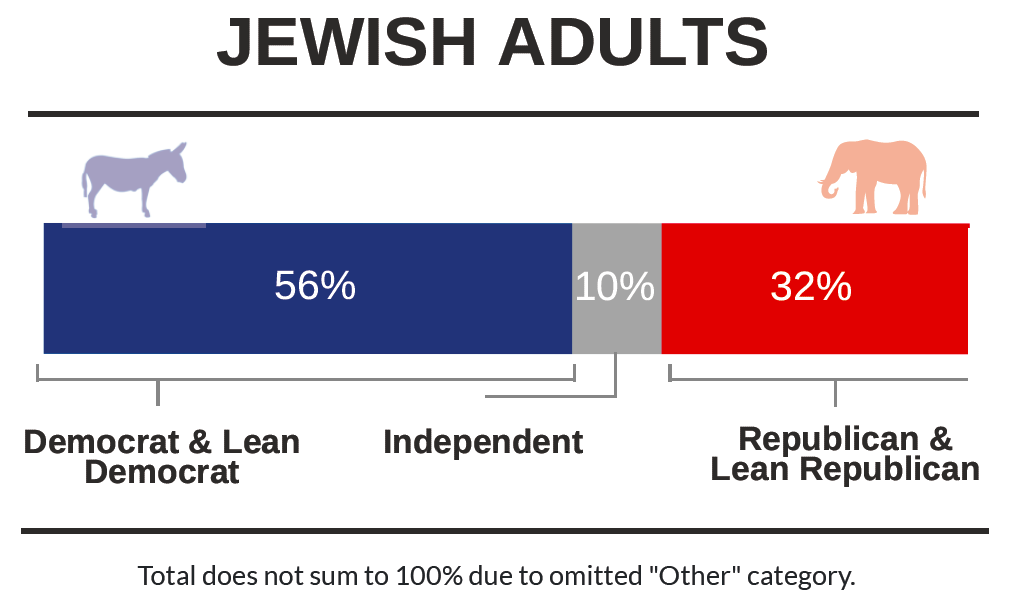
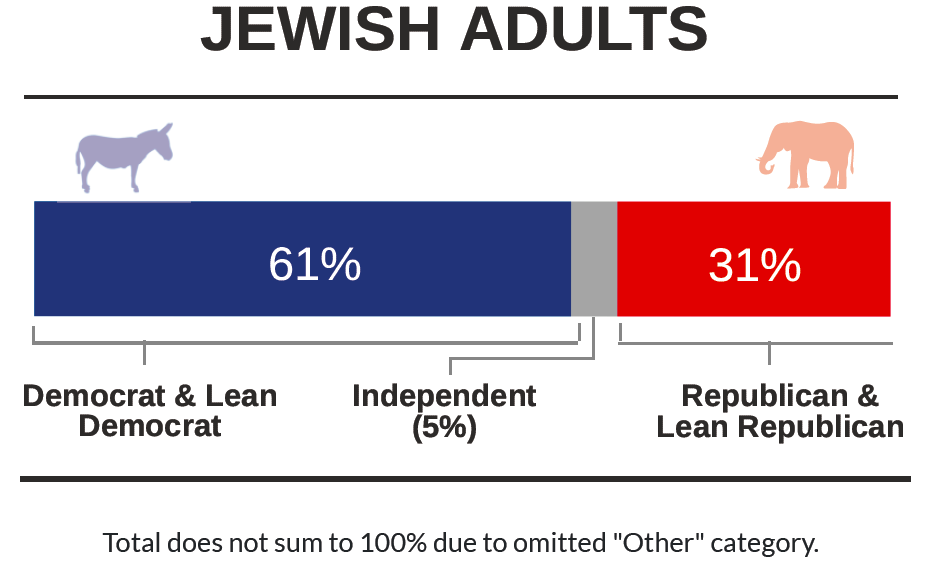
The majority of Jewish adults (~60%) in Ohio reside in congressional districts that include the metropolitan areas around Cleveland, Columbus, and Cincinnati. The Jewish electorate predominately identifies with or leans toward the Democratic Party (56%). About one third (32%) identify with or lean toward the Republican Party.
Full Pennsylvania Report
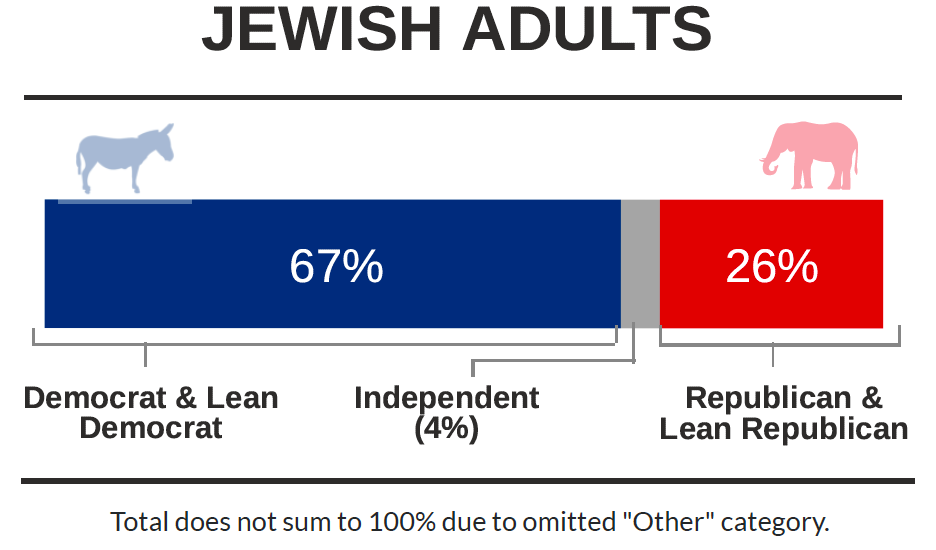
The majority (~78%) of Jewish adults in Pennsylvania resides in eight congressional districts. All, with the exception of PA-18, are located in an Eastern region of the state known as the Delaware Valley. About two thirds (67%) of Pennsylvania’s Jewish electorate identifies with or leans toward the Democratic Party compared with 65% of the Jewish electorate nationally.
Full Wisconsin Report
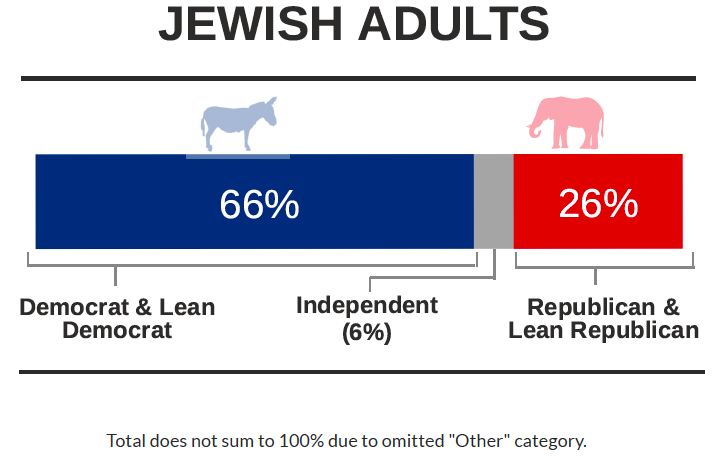
Over half of Jewish adults in Wisconsin (~57%) reside in just two of the state’s congressional districts, spanning the metropolitan and suburban areas of Milwaukee and Madison. Two thirds (66%) of the Wisconsin Jewish electorate identifies with or leans toward the Democratic Party compared with 65% of the Jewish electorate nationally
Full Report on Political Independents
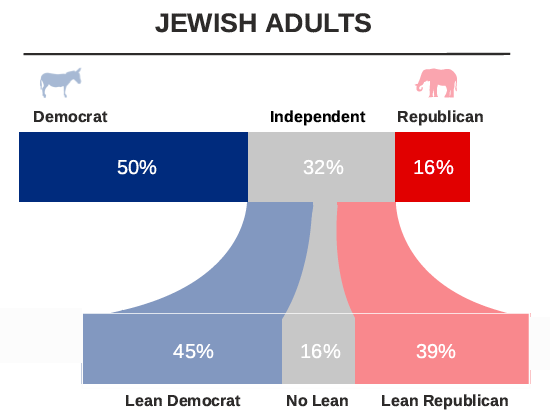
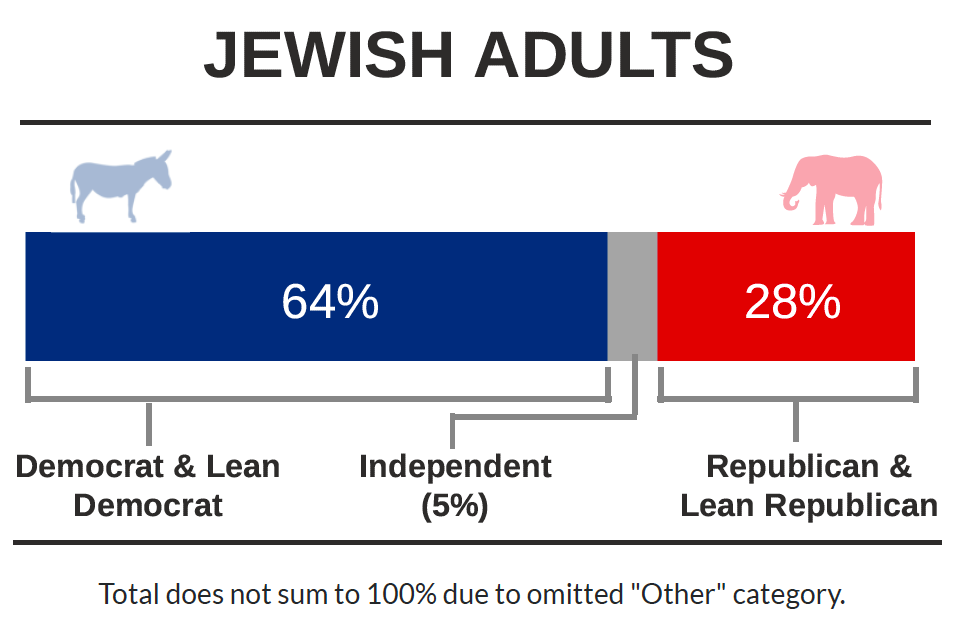
The American Jewish electorate has a reputation of being stalwart supporters of the Democratic Party and indeed, estimates of political identification show that three times as many Jewish adults are Democrats than are Republicans (50% vs 16%, respectively).
Independents comprise the second largest group. Of the 32% of the Jewish electorate who are Independent, when asked if they lean toward either the Democratic or Republican Party, most lean Democrat (45%). Just 16% of Independents, or about 5% of all Jewish adults, lean neither Democrat nor Republican.
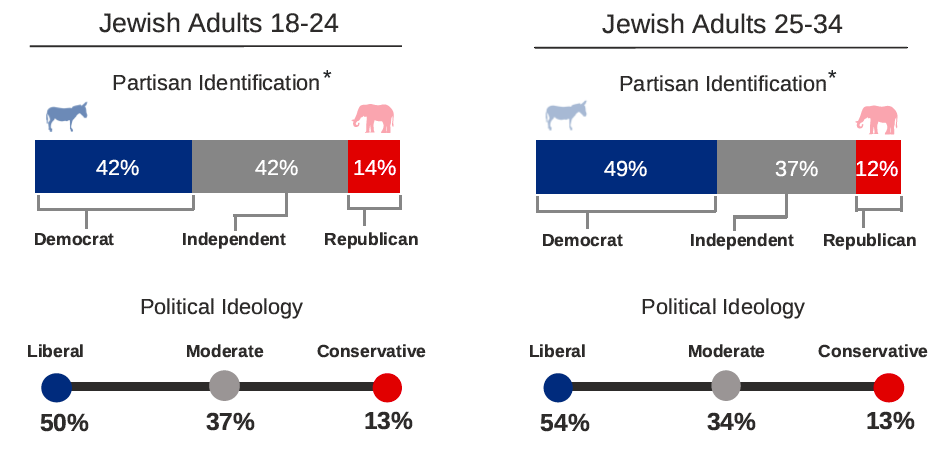
Full Report on Jewish Young Adults
Identification with the Democratic Party is highest among Jewish adults ages 25 to 34 compared with the youngest age group of 18 to 24 year olds (49% vs. 42%, respectively). Few young adults in either age group are Republican; 14% of 18 to 24 year-olds and just 12% of 25 to 34 year-olds are Republican.