

Summary
At the request of the non-partisan Jewish Electorate Institute, researchers at the American Jewish Population Project at Brandeis University’s Steinhardt Social Research Institute conducted an analysis of hundreds of national surveys of US adults to describe the Jewish electorate in each of the 435 districts of the 116th Congress and the District of Columbia. Surveys include the American National Election Studies, the General Social Survey, Pew Political and social surveys, the Gallup Daily Tracking poll, and the Gallup Poll Social Series. Data from over 1.4 million US adults were statistically combined to provide, for each congressional district, estimates of the number of adults who self-identify as Jewish by age, education, race/ethnicity, as well as political party self-identification and political ideology.¹
Key Findings
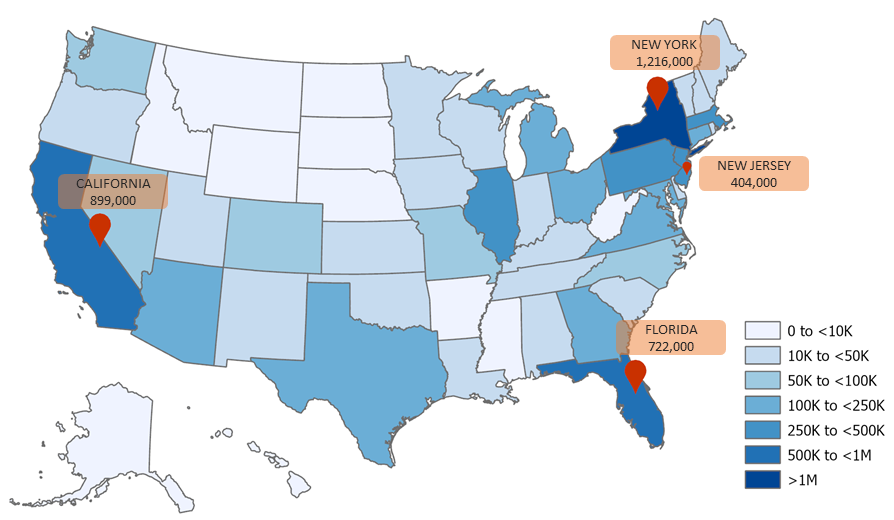
1. The majority of the Jewish electorate is in four states – New York, California, Florida, and New Jersey.
There are over 1.2 million Jewish adults in New York state, nearly 900,000 in California, 722,000 in Florida and just over 400,000 in New Jersey.
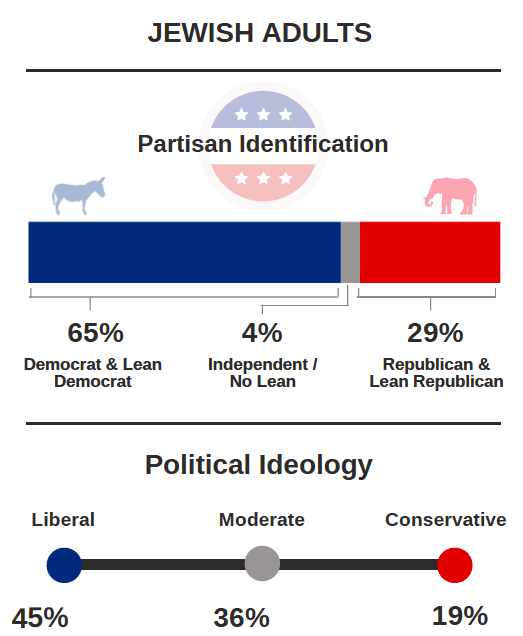
2. Jewish adults identify predominantly as liberal and with the Democratic Party.
The Democratic Party is the most popular political party among Jewish adults with a total of 65% identifying as or leaning toward the Democrats. About one in three Jewish adults identify as or lean Republican (29%) while just 4% identify as Independent who do not lean toward either party. Regardless of party self- identification, the majority (71%) of the Jewish electorate typically votes for the Democratic candidate in presidential elections. ²
A plurality of Jewish adults identify as liberal (45%) when asked about their political views. A little over a third of Jewish adults identify as moderate (36%), and about a fifth identify as conservative (19%).
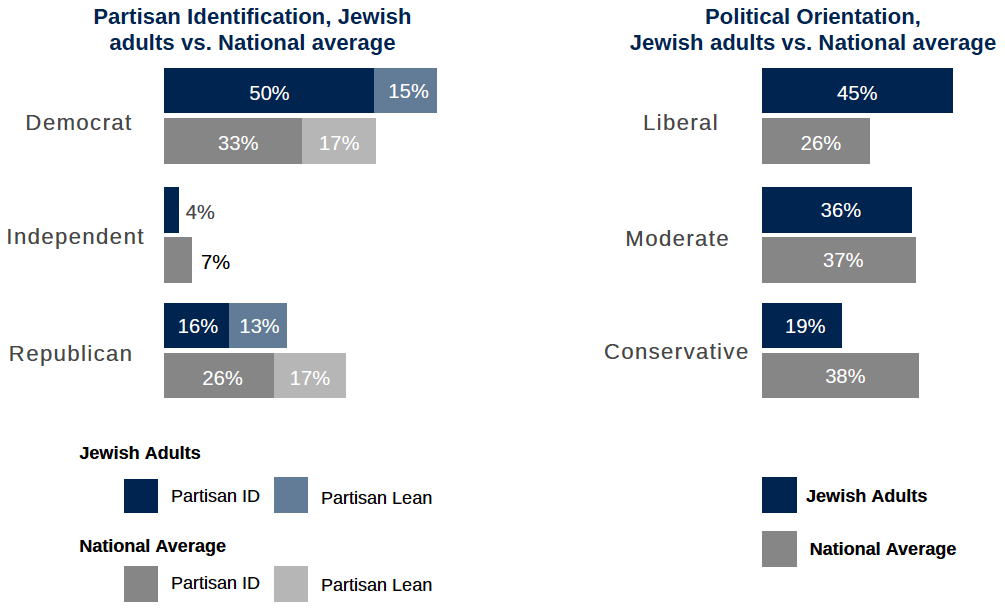
3. Jewish adults are also more likely to identify as Democrats and liberal when compared to the national average.
Nationally, half of US adults identify with or lean toward the Democratic Party (50%) and about one-quarter identify as liberal (26%), far fewer than Jewish adults (65% and 45%, respectively).
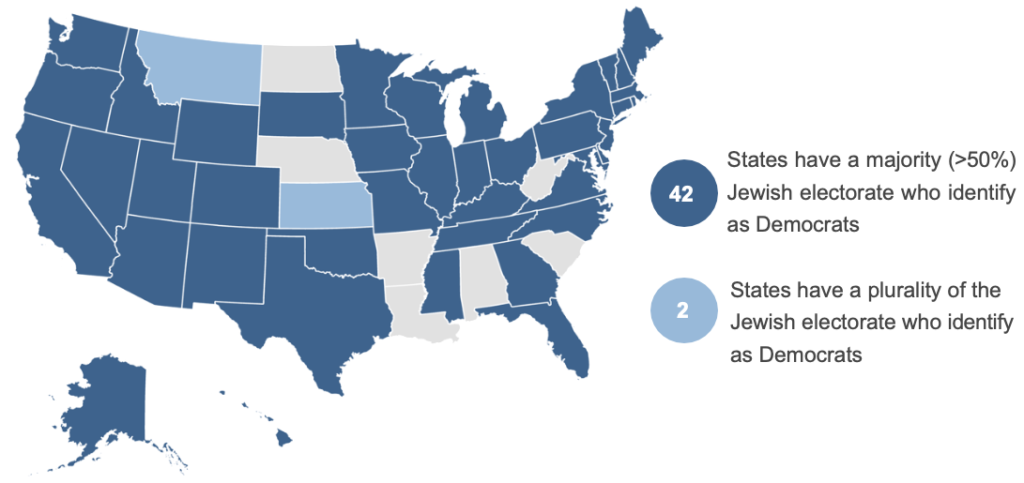
4. Most states have a majority (50% or more) of the Jewish electorate identifying as Democrats and the Democratic Party is the most popular party among Jewish adults in 44 states plus the District of Columbia.
The tendency among the Jewish electorate to identify with the Democratic Party is pervasive in American politics where 9 in 10 states show a plurality of Jewish adults identifying as Democrats.
5. Approximately 1.8 million Jewish adults, just under one-third of the total Jewish electorate, live in twenty congressional districts.
Of the top twenty districts by Jewish population, nearly half are in New York — NY-10, NY-3, NY-12, NY-17, NY-4,NY-9, NY-6, NY-8, and NY-11.
The remaining districts with large Jewish populations are found in seven states including Florida, California, Illinois, New Jersey, Massachusetts, Maryland, and Pennsylvania. FL-21 has the greatest number of Jewish adults at 152,000. With the exception of NJ-4, these districts are represented by Democrats and all but two (NJ-4 and NJ-5) are Democratic-leaning districts.
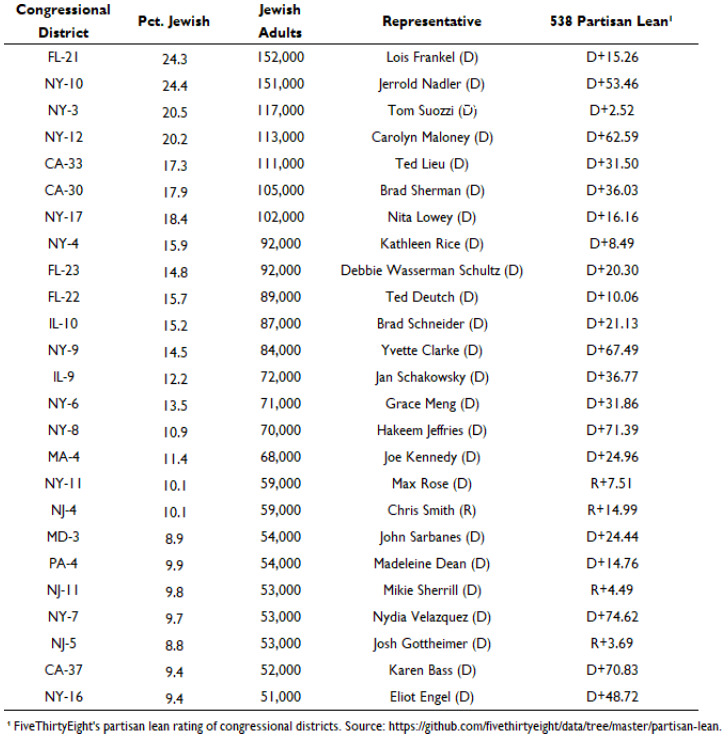
6. The Jewish electorate in districts with the largest Jewish populations also leans Democratic.
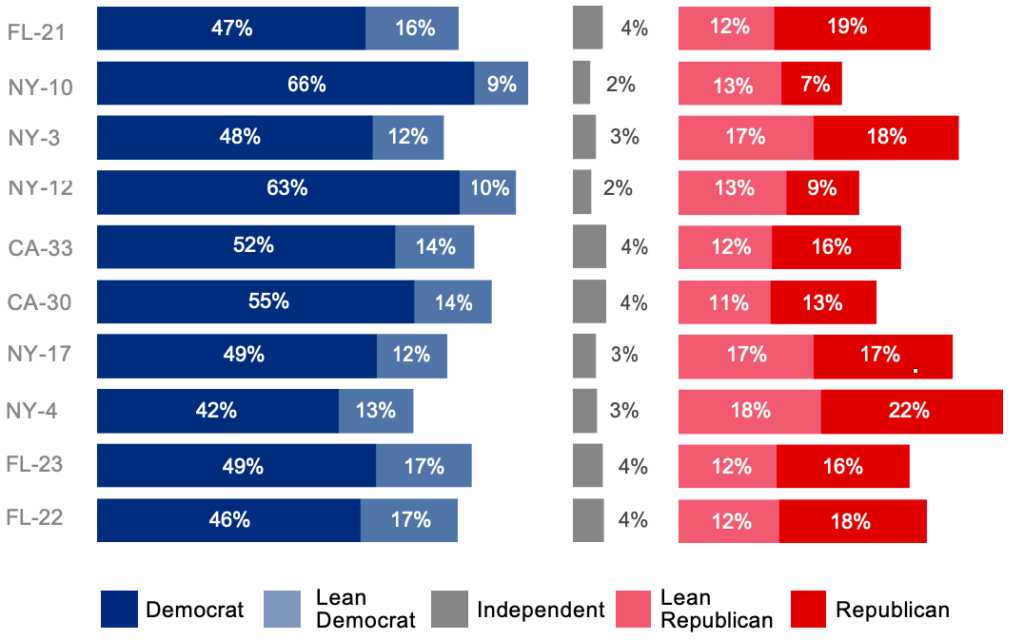
The percentage of Jewish adults who identify as Democrats ranges from 66% in NY-10 and 63% in NY-12 to a low of 42% in NY-4. In these districts where Jewish adults represent a strong Democratic base, an additional group ranging from 9% of Jewish adults in NY-10 to 17% of Jewish adults in districts FL-22 and FL-23 lean Democratic.³
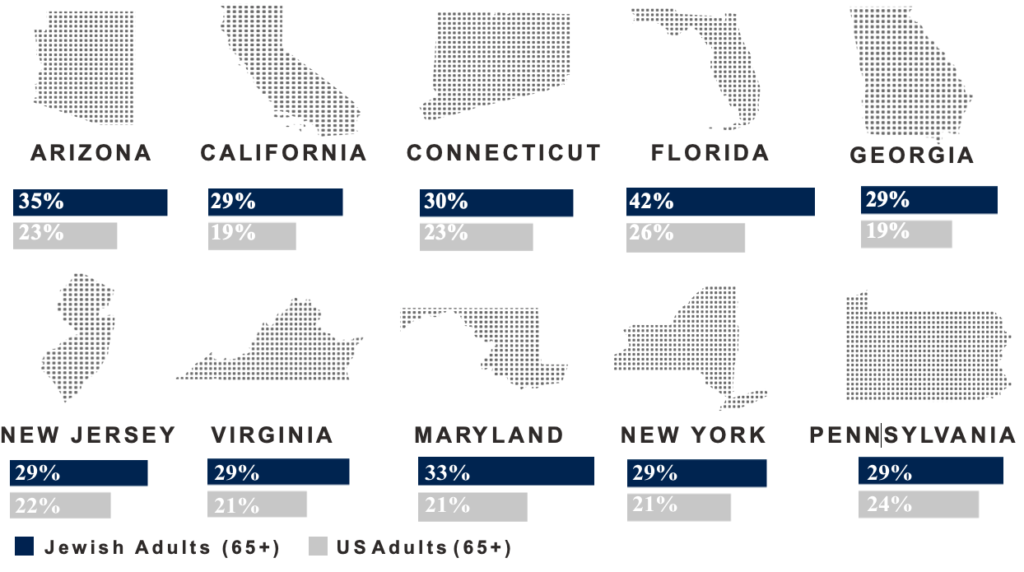
7. The Jewish electorate tends to be older than US adults overall.
In Florida, where just more than one-quarter (26%) of all adults are aged 65 years and older, over 40% of the Jewish electorate are aged 65 years or older. The pattern is similar in other states, including Arizona and Maryland where 35% and 33% of the Jewish electorate, respectively, are aged 65 years and older compared to 23% and 21% of all adults in those states.
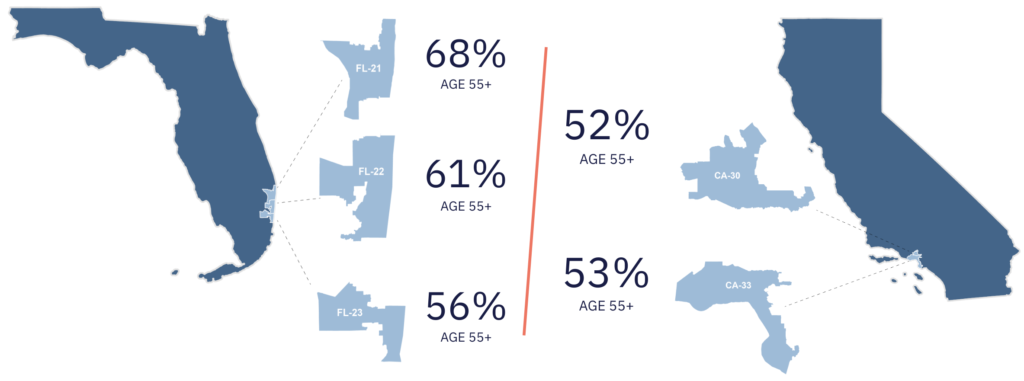
8. Congressional districts with the largest numbers of Jewish adults also have predominantly older Jewish populations.
In the top five districts outside of New York, over 50% of the Jewish electorate is age 55 or older. In FL-21, over 50% of the Jewish electorate is aged 65 years or older.
Conclusion
Results from the analysis of hundreds of independent surveys provide a portrait of the Jewish electorate across the 435 congressional districts of the 116th Congress both in terms of the size of the electorate, demographic composition of the electorate, as well as political orientation in terms of party self-identification and political views (liberal/conservative). New York, Florida, and California have the highest percentages of Jewish adults among the electorate, ranging from 24% in FL-21 (152,000 Jewish adults) and in NY-10 (151,000 Jewish adults) to 9% in MD-3 (54,000 Jewish adults). The Jewish electorate in these districts is predominantly older. Over 50% of the Jewish electorate in FL-21 is aged 65 years or older. Results also indicate that more Jewish adults identify with or lean toward the Democratic Party (65%) than as Republican (29%), and liberal (45%) than as conservative (19%).
¹ Methodology: Individual-level data from all surveys were combined using Bayesian Multilevel Modeling with Poststratification. Poststratification included geographic distributions of respondents by zip codes within congressional districts, and demographic characteristics of age, educational attainment, race/ethnicity, population density, as well as interactions of age by educational attainment, population density by age, and population density by educational attainment. Modeling is based to Jewish adults who self-identify as Jewish when asked about their religion. Estimates of “Total Jewish Adults” are obtained by adding to the model-based estimate, independent estimates of the percentage of Jewish adults who do not identify religiously as Jewish. This percentage can range from a low of 10% to a high of 30% depending on the region.
² Eleven of the surveys included in the AJPP data synthesis asked about voting in the previous presidential election. Meta-analysis of these eleven surveys indicated that just over 71% of Jewish adults voted for the Democratic candidate regardless of party self- identification. This estimate is identical to Pew Research Center’s analysis of national exit poll data (2016), which found that 71% of Jewish adults voted for the Democratic candidate (source: https://www.pewresearch.org/fact-tank/2016/11/09/how-the-faithful-voted-a- preliminary-2016-analysis/)
³ State-level proportion of Independents who lean Democrat or lean Republican applied to congressional districts.